Download "At the Farmgate" Chapter
This chapter provides an updated assessment of the potential economic availability of biomass resources from agricultural lands reported at the farmgate. Resources evaluated in this chapter include crop residues and dedicated biomass energy crops (herbaceous and woody) produced on agricultural land. Both of these biomass types can play a unique and important role in a national biofuels commercialization strategy. This study employed the Policy Analysis System (POLYSYS) and found the following range of residues and energy crops to be economically available at a farmgate price of ≤40 – ≤80 under imposed constraints: between 30 million tons and 734 million tons under a baseline scenario of 1% yield growth per year, and up to 1.068 billion tons under a high-yield scenario of 3%. Supply potentials vary by year, with a greater supply potential occurring in later years of the simulations as energy crops are established and return higher yields.
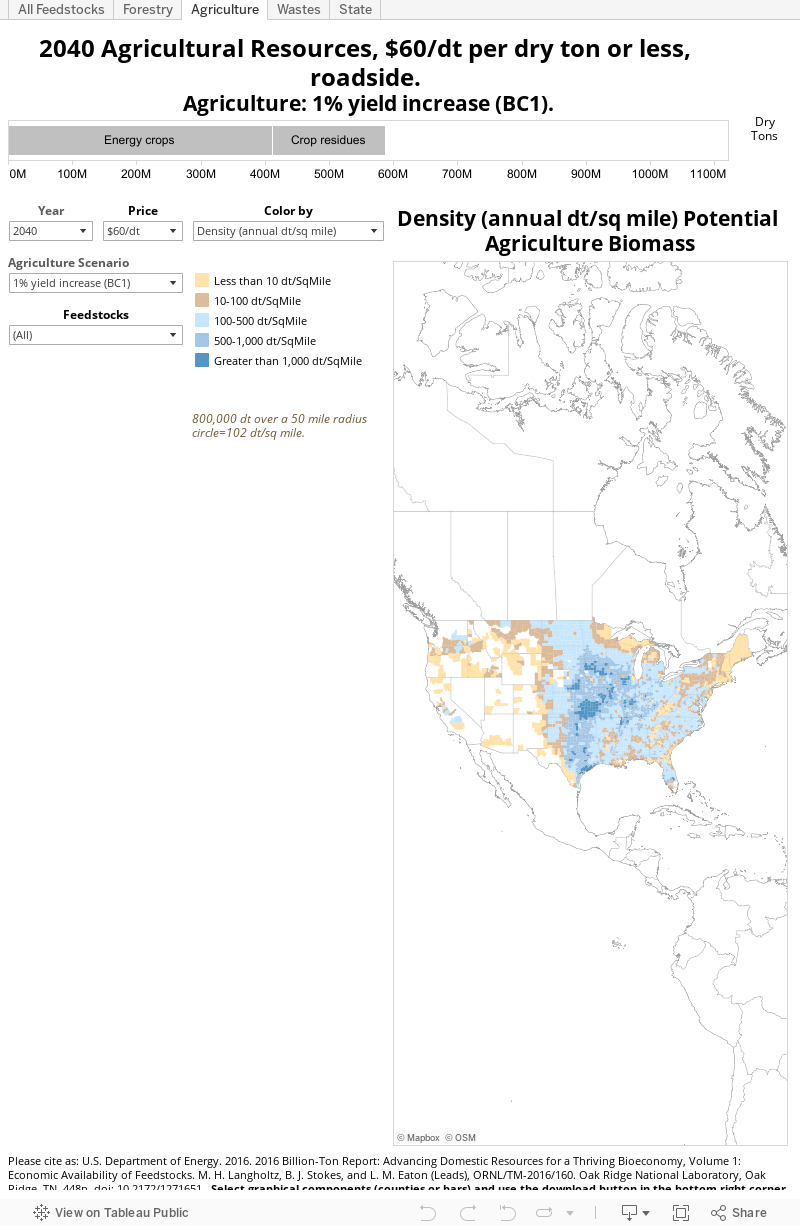
Figure ES.2: . County-level map of primary agricultural resources at the county-level for all feedstocks identified in chapter 4. Feedstock supply is reported by default as a density value, potential county-level supply at the farmgate divided by county land area. Supply quantities in blue are correlated to having a feedstock density of 100 dry tons per square mile or more, which corresponds to the approximate minimum quantity to supply a hypothetical facility at 800,000 dry tons per year.
National map of final year supply by scenario and bar graphs supply distribution for lead up years. User can explore feedstocks of interest and lead up years to change national map and bar graphs
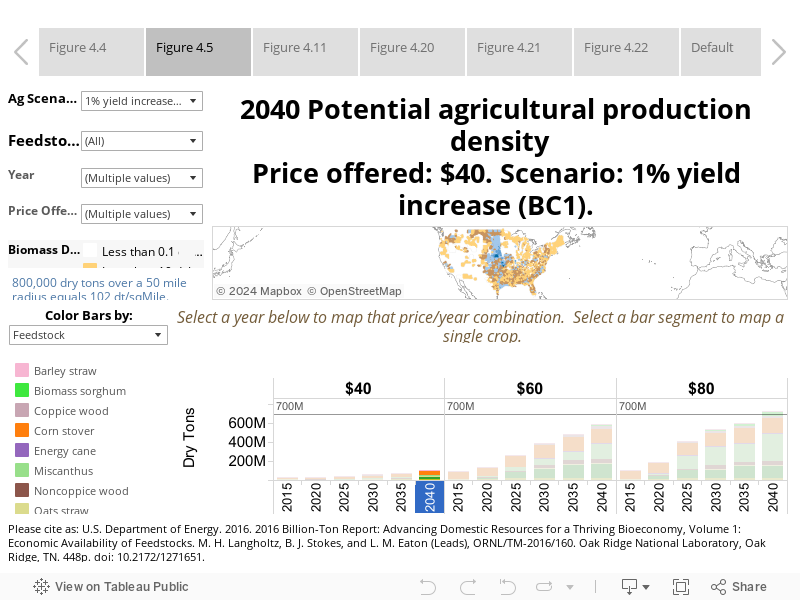
3 : Map with stacked bars, by year and cost
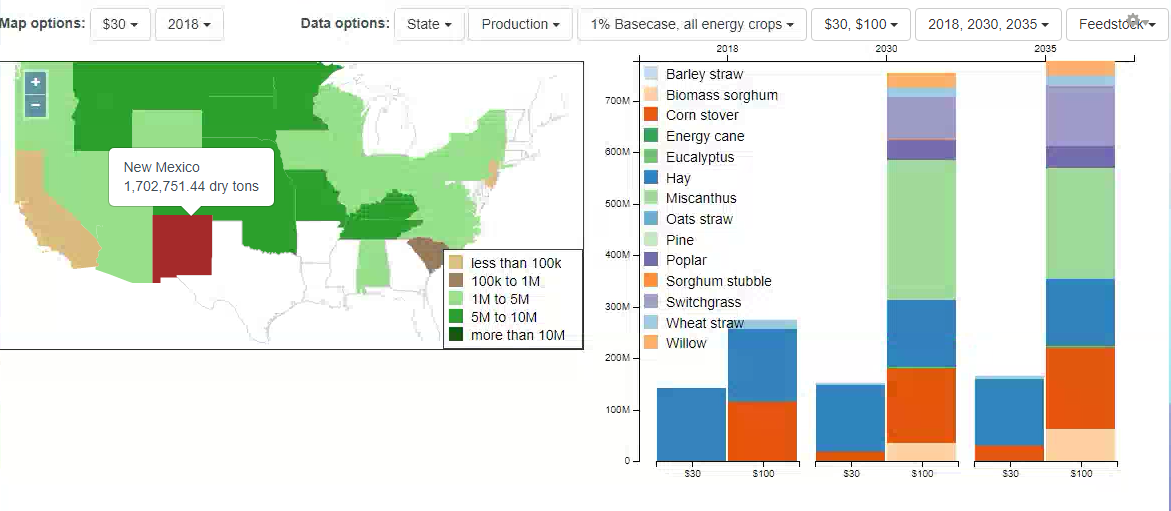
State or county-level map with corresponding stacked bar chart below by year and cost. Hover and select areas of interest and choose density or production display
Figures C-4 through C-9: National county-level explorer or energy crop mature yield (as dry tons per acre year for herbaceous crops, mean annual increment at harvest for woody crops) and discounted average cost of production (including establishment, maintenance, harvest, and land rent). Assumes 6.5% discount rate and the following planning horizon length by crop: 1 year, biomass sorghum; 7 years, energy cane and eucalyptus; 8 years, poplar and pine; 10 years, switchgrass; 15 years, miscanthus; 20 years, willow
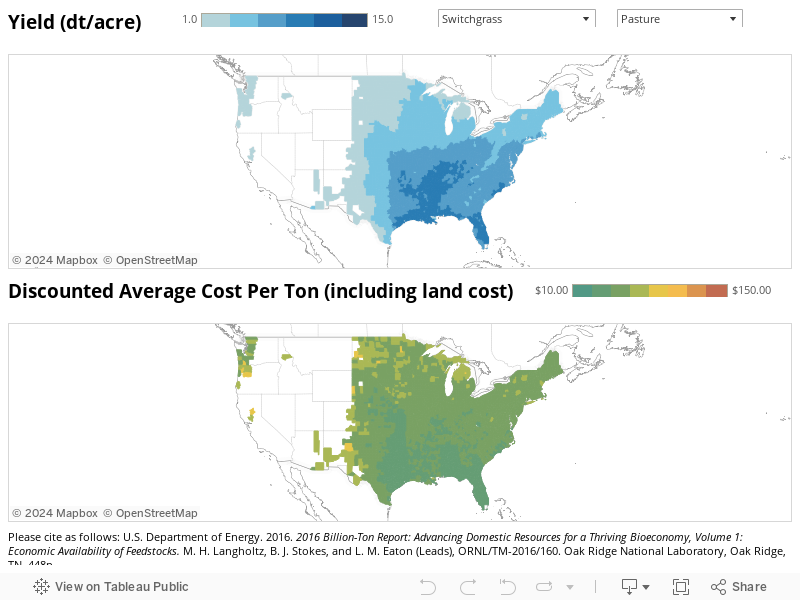
Table 4.4: Distribution of Land Use Under High-Yield Assumptions for Select Years at <=$60 Offered Farmgate Price
| Land Use Type | 2017 | 2022 | 2030 | 2040 |
|---|---|---|---|---|
| (million acres) | ||||
| Energy crop land allocation (planted) | N/A | 28.3 | 57.87 | 87.35 |
| Cropland allocation (planted) | N/A | 15.39 | 27.8 | 48.95 |
| Cropland used as pasture allocation (planted) | N/A | 1.29 | 2.31 | 2.54 |
| Permanent pastureland allocation (planted) | N/A | 11.62 | 27.76 | 36.46 |
| Energy crops (harvested/fraction) | N/A | 17.11/0.60 | 41.63/072 | 64.12/0.73 |
| Corn (planted) | 90.36 | 84.55 | 79.67 | 74.33 |
| Corn stover (harvested) | 46.76 | 51.93 | 53.45 | 50.38 |
| Other crops with residues (planted) | 65.87 | 58.72 | 56.35 | 52.48 |
| Other crops with residues (harvested) | 19.41 | 23.37 | 28.02 | 29.51 |
| Percent of total U.S. cropland (325.6 million acres) allocated to energy crops | N/A | 4.7% | 8.5% | 15% |
| Percent of total U.S. pastureland (446.2 million acres) allocated to energy crops | 0% | 2.9% | 6.7% | 87% |
| U.S. major crops with residues (acreage), %harvested for biomass | 156.20, 42.4% | 143.30, 52.6% | 136.00, 59.9% | 126.80, 63% |
| % of U.S. cropland contributing to biomass production (energy crops planted and residue harvested) | 20.3% | 27.9% | 33.6% | 39.6% |
Figures 4.9 and 4.10: Acreage allocation by major crops on cropland (including energy crops), eligible pasture available, and assumed land idled across highlight years and selected prices and years
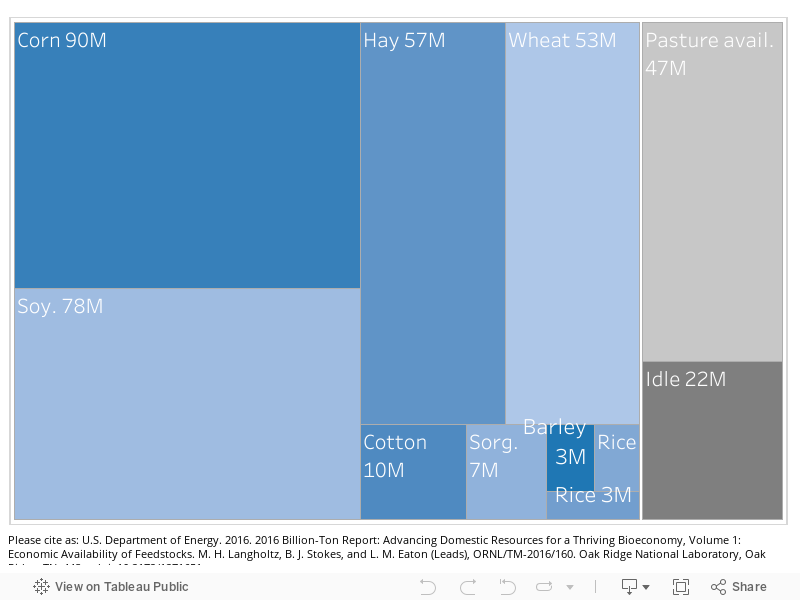
Figure 4.16: Agricultural residues available across four exogenous price scenarios in the year 2035.

Figure 4.17: Herbaceous energy crops available across four exogenous price scenarios in the year 2035.

Figure 4.18: Woody energy crops available across four exogenous price scenarios in the year 2035.

Figure 4.19: Total biomass resources from agricultural lands available across four exogenous price scenarios in the year 2035.

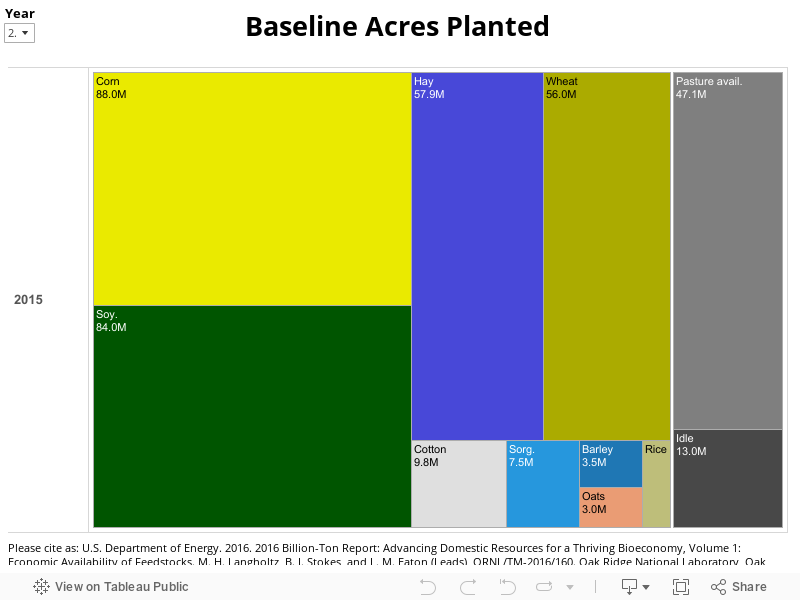
8 : Acres Planted
Figure 4.3: Box plot of assumed baseline acres planted by year.