Download "Waste Resources" Chapter
Waste resources are quite varied, and in the 2016 Billion-Ton Report they include 24 resources from agriculture (cotton gin trash, cotton field residues, grain dust and chaff, orchard and vineyard prunnings, rice hulls, rice straw, sugar cane bagasse, sugar cane trash, soybean hulls, animal fats, yellow grease, animal manure, and the garbage fraction part of municipal solid wastes [MSW]), forestry (other residue removals, treatment thinnings from other forestland, unused primary and secondary mill residues, urban wood wastes/construction and demolition [C&D], and urban wood wastes from MSW), and other resources (biosolids, brown trap grease, food wastes [industrial, institutional, and commercial], landfill gas, and utility tree trimmings). Only resources in addition to those currently used are estimated in this chapter. Some resources are excluded from the estimates because they are currently used (sugarcane bagasse, soybean hulls), and some do not enter into the estimated resources at given prices because they are too expensive (grain dust and chaff, animal fats). At $60 per dry ton, the largest resources are from MSW—garbage fraction, animal manure, and urban wood wastes/C&D. In the aggregate, waste resources in 2040 total 155 million dry ton at $60 per dry ton and 229 billion ft3 of additional landfill gas.
Figure ES.3: Total production or density of potentially available individual, multiple, or total waste resources from agricultural, forestry and wood, and other sources available at $40, $60, or $80 per dry ton or less are estimated and can be mapped for the years 2017, 2022, 2025, 2030, 2035, and 2040.
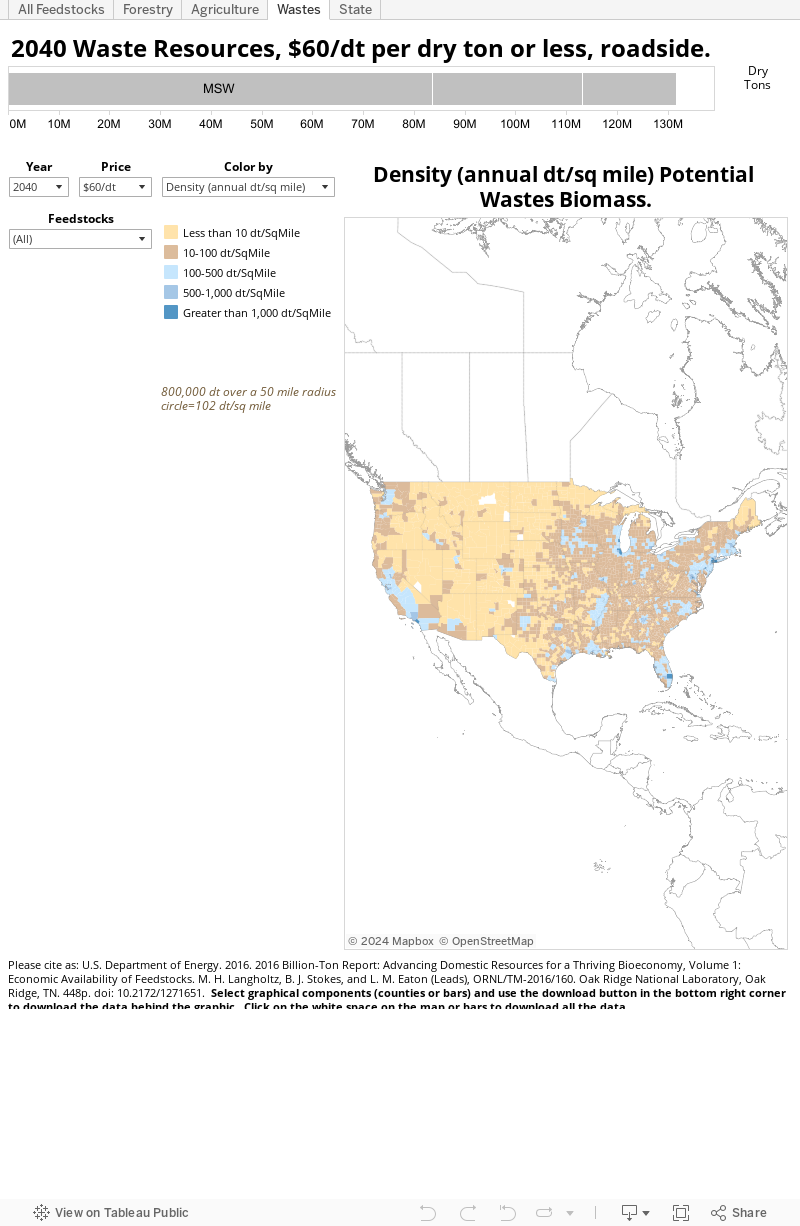
Table 5.1: Summary of Agricultural Wastes
Total agricultural waste potential at $40 to $60 per dry ton ranges from 27 to 37 million dry tons. Agricultural waste resources potentially available (million dry tons) at $40, $50, and $60 are summarized at the national level for 2017, 2022, 2030, and 2040 in table 5.1. Animal manure accounts for about half of the agricultural waste potential. Some resources are not available in this range of prices (grain dust and chaff, soybean hulls).
| Waste type | Current Supplya | 2017 | 2022 | 2030 | 2040 | ||||||||
|---|---|---|---|---|---|---|---|---|---|---|---|---|---|
| $40 | $50 | $60 | $40 | $50 | $60 | $40 | $50 | $60 | $40 | $50 | $60 | ||
| Million Dry Tons | |||||||||||||
| Animal Manure | 17.1 | 18.0 | 18.0 | 18.0 | 18.5 | 18.5 | 18.5 | 18.6 | 18.6 | 18.6 | 18.4 | 18.4 | 18.4 |
| Cotton field residues | 3.3 | 0.0 | 0.9 | 1.5 | 0.0 | 1.5 | 2.0 | 0.0 | 1.7 | 2.2 | 0.0 | 1.7 | 3.2 |
| Cotton gin trash | 1.7 | 1.7 | 1.7 | 1.7 | 1.9 | 1.9 | 1.9 | 2.0 | 2.0 | 2.0 | 2.1 | 2.1 | 2.1 |
| Grain dust and chaff | 5.1 | 0.0 | 0.0 | 0.0 | 0.0 | 0.0 | 0.0 | 0.0 | 0.0 | 0.0 | 0.0 | 0.0 | 0.0 |
| Orchard and vineyard prunings | 5.5 | 5.5 | 5.5 | 5.5 | 5.6 | 5.6 | 5.6 | 5.8 | 5.9 | 5.8 | 6.0 | 6.0 | 6.0 |
| Rice straw | 4.3 | 0.0 | 4.9 | 4,9 | 0.0 | 5.2 | 5.2 | 0.0 | 5.4 | 5.4 | 0.0 | 5.6 | 5.6 |
| Rice hulls | 1.2 | 1.4 | 1.4 | 1.4 | 1.5 | 1.5 | 1.5 | 0.0 | 1.5 | 1.5 | 0.0 | 1.6 | 1.6 |
| Soybean hulls | 2.8 | 0.0 | 0.0 | 0.0 | 0.0 | 0.0 | 0.0 | 0.0 | 0.0 | 0.0 | 0.0 | 0.0 | 0.0 |
| Sugarcane field trash | 1.1 | 0.6 | 1.0 | 1.0 | 0.6 | 1.1 | 1.1 | 0.6 | 1.1 | 1.1 | 0.6 | 1.1 | 1.1 |
| Total | 34.2 | 27.1 | 33.4 | 34.0 | 28.0 | 35.3 | 35.7 | 27.0 | 36.1 | 36.6 | 27.1 | 36.5 | 37.0 |
Table 5.13: Summary of Baseline Potential of All Biomass and Wood Wastes
Total waste potential at $40 to $60 per dry ton ranges from 123 to 155 million dry tons. MSW and agricultural, forestry, and wood-based waste, and other resources potentially available (million dry tons) at $40, $50, and $60 are summarized at the national level for 2017, 2022, 2030, and 2040 in table 5.13. MSW and forestry and wood-based waste each account for about 1/3 of the total and agricultural wastes are about 20% to 25% of the total.
| Feedstock ($ per dry ton) | 2017 | 2022 | 2030 | 2040 | ||||||||
|---|---|---|---|---|---|---|---|---|---|---|---|---|
| $40 | $50 | $60 | $40 | $50 | $60 | $40 | $50 | $60 | $40 | $50 | $60 | |
| Million Dry Tons | ||||||||||||
| Agricultural | 27 | 33 | 34 | 28 | 35 | 36 | 27 | 36 | 37 | 27 | 36 | 38 |
| MSWa | 51 | 55 | 55 | 51 | 55 | 55 | 51 | 55 | 55 | 51 | 55 | 55 |
| Forestry | 36 | 45 | 49 | 38 | 47 | 51 | 39 | 49 | 53 | 39 | 49 | 53 |
| Other | 8.7 | 8.7 | 8.7 | 8.9 | 8.9 | 8.9 | 9.2 | 9.2 | 9,2 | 9.4 | 9.4 | 9.4 |
| Total | 123 | 142 | 147 | 126 | 146 | 151 | 126 | 149 | 154 | 126 | 149 | 155 |